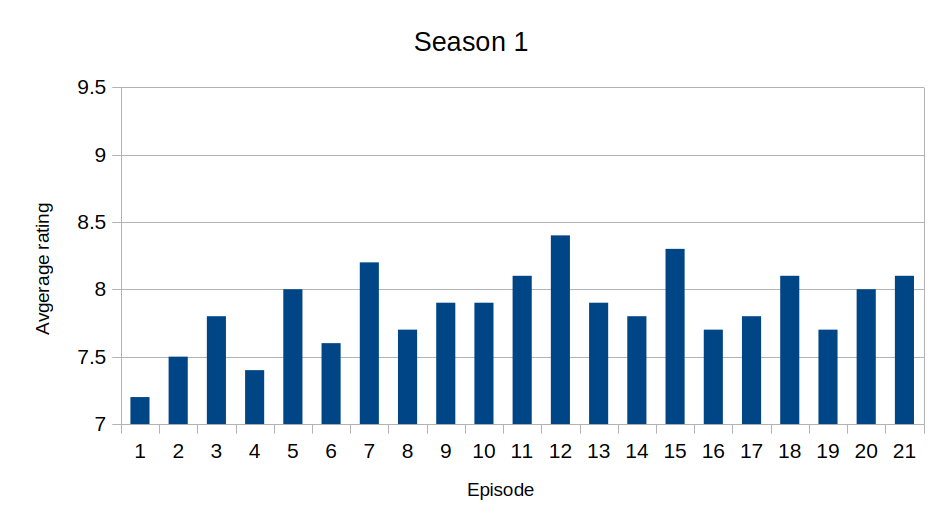
I couldn’t think of a single bad episode, so I was curious what other people thought was the worst. Both the pilot and the second Queen of Jordan were rated the worst, at 7.2. Still a pretty good rating!
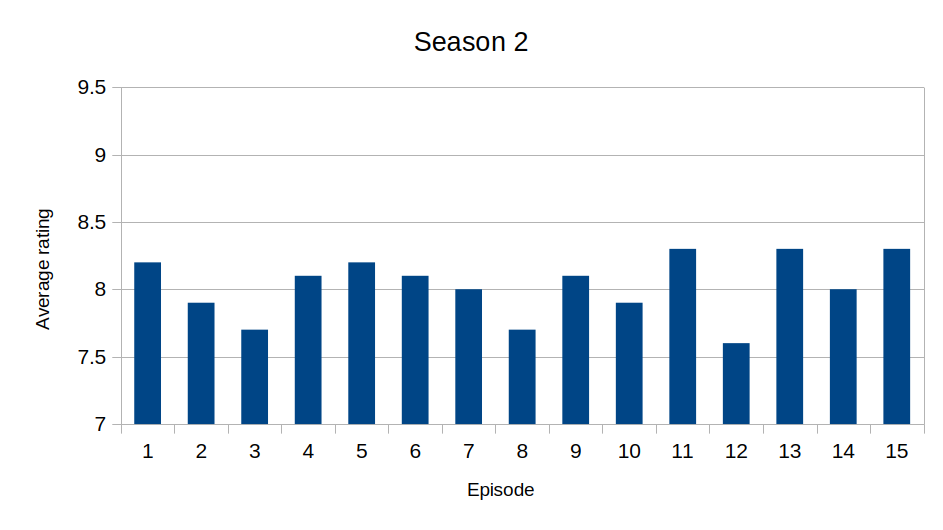
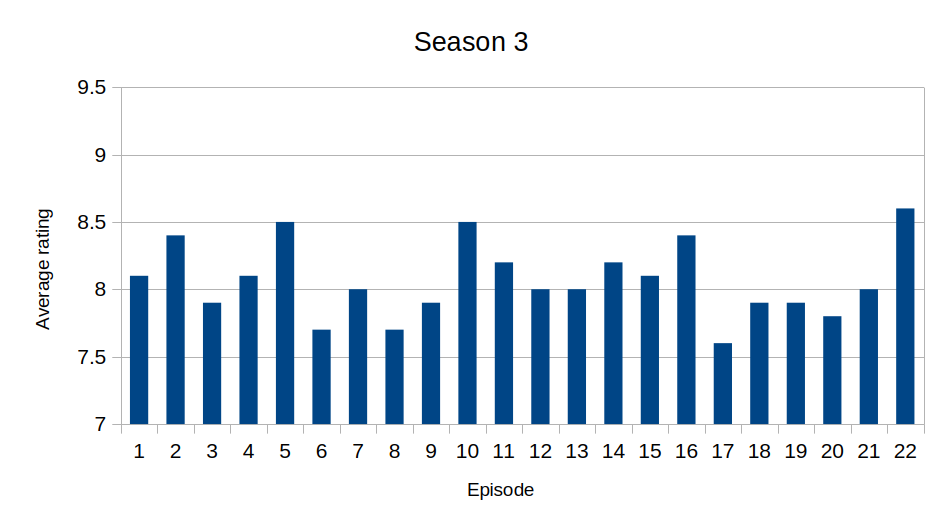
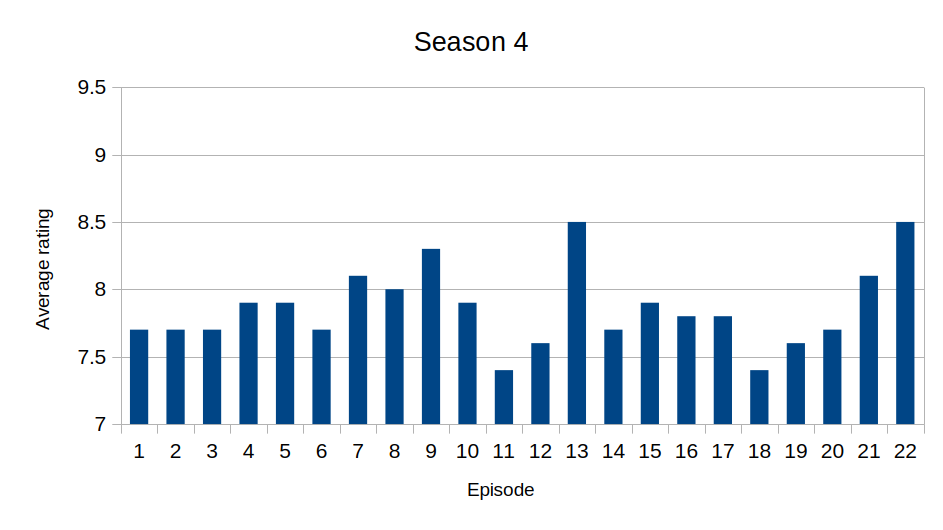
- Note that the Y axis on each chart does not go from 0-10. They are all 7-9.5.
- Data source: IMDb
- Tools used: LibreOffice Calc, GIMP
Season 1 chart
Season 2 chart
Season 3 chart
Season 4 chart
Season 5 chart
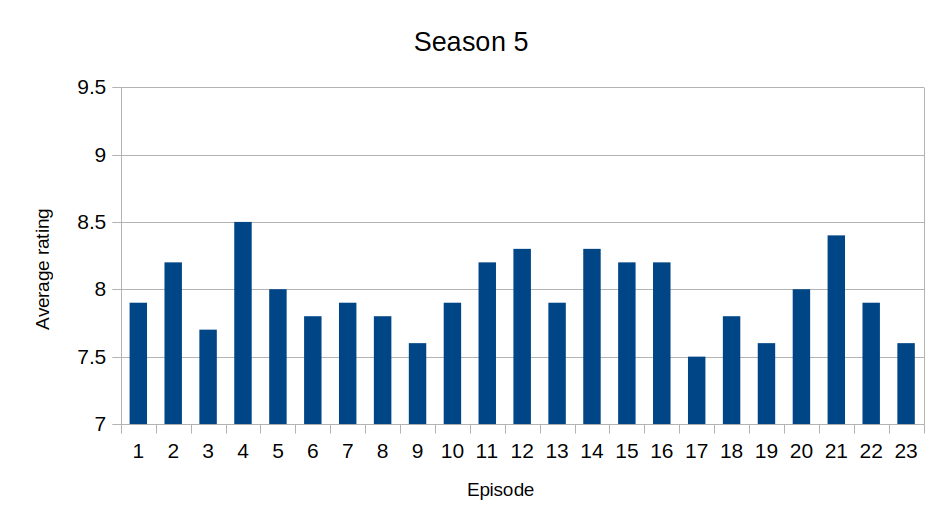
Season 6 chart
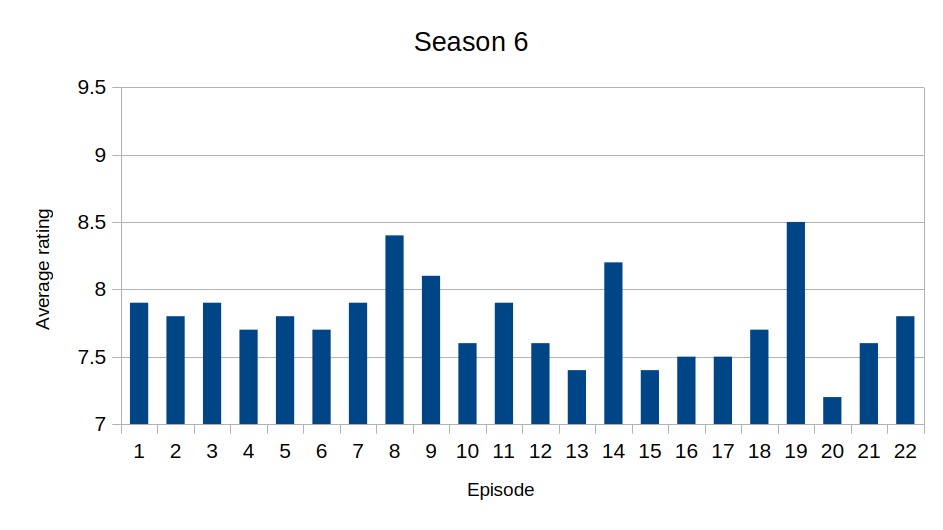
Season 7 chart
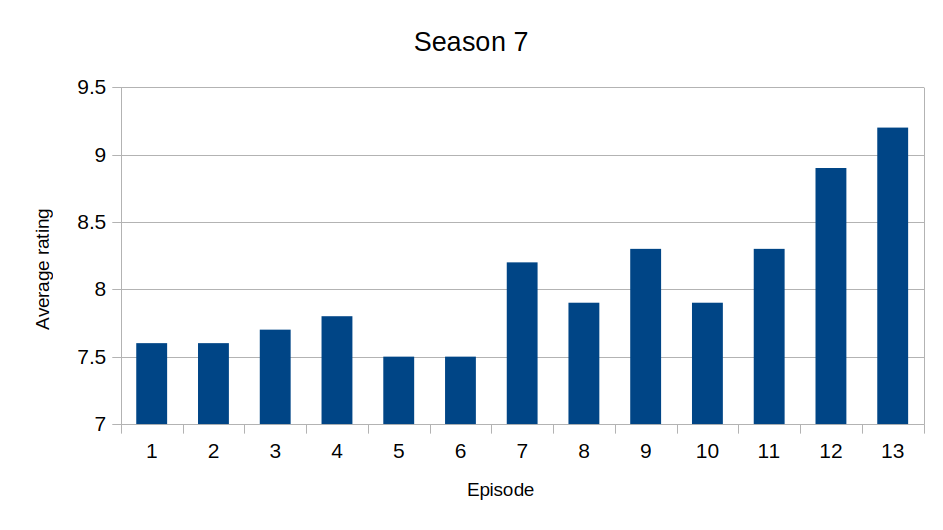
Raw data
| Season | Episode | Chronological | Name | Rating |
|---|---|---|---|---|
| 1 | 1 | 1 | Pilot | 7.2 |
| 1 | 2 | 2 | The Aftermath | 7.5 |
| 1 | 3 | 3 | Blind Date | 7.8 |
| 1 | 4 | 4 | Jack the Writer | 7.4 |
| 1 | 5 | 5 | Jack-Tor | 8.0 |
| 1 | 6 | 6 | Jack Meets Dennis | 7.6 |
| 1 | 7 | 7 | Tracy Does Conan | 8.2 |
| 1 | 8 | 8 | The Break-Up | 7.7 |
| 1 | 9 | 9 | The Baby Show | 7.9 |
| 1 | 10 | 10 | The Rural Juror | 7.9 |
| 1 | 11 | 11 | The Head and the Hair | 8.1 |
| 1 | 12 | 12 | Black Tie | 8.4 |
| 1 | 13 | 13 | Up All Night | 7.9 |
| 1 | 14 | 14 | The C Word | 7.8 |
| 1 | 15 | 15 | Hard Ball | 8.3 |
| 1 | 16 | 16 | The Source Awards | 7.7 |
| 1 | 17 | 17 | The Fighting Irish | 7.8 |
| 1 | 18 | 18 | Fireworks | 8.1 |
| 1 | 19 | 19 | Corporate Crush | 7.7 |
| 1 | 20 | 20 | Cleveland | 8.0 |
| 1 | 21 | 21 | Hiatus | 8.1 |
| 2 | 1 | 22 | Seinfeldvision | 8.2 |
| 2 | 2 | 23 | Jack Gets in the Game | 7.9 |
| 2 | 3 | 24 | The Collection | 7.7 |
| 2 | 4 | 25 | Rosemary’s Baby | 8.1 |
| 2 | 5 | 26 | Greenzo | 8.2 |
| 2 | 6 | 27 | Somebody to Love | 8.1 |
| 2 | 7 | 28 | Cougars | 8.0 |
| 2 | 8 | 29 | Secrets and Lies | 7.7 |
| 2 | 9 | 30 | Ludachristmas | 8.1 |
| 2 | 10 | 31 | Episode 210 | 7.9 |
| 2 | 11 | 32 | MILF Island | 8.3 |
| 2 | 12 | 33 | Subway Hero | 7.6 |
| 2 | 13 | 34 | Succession | 8.3 |
| 2 | 14 | 35 | Sandwich Day | 8.0 |
| 2 | 15 | 36 | Cooter | 8.3 |
| 3 | 1 | 37 | Do-Over | 8.1 |
| 3 | 2 | 38 | Believe in the Stars | 8.4 |
| 3 | 3 | 39 | The One with the Cast of ‘Night Court’ | 7.9 |
| 3 | 4 | 40 | Gavin Volure | 8.1 |
| 3 | 5 | 41 | Reunion | 8.5 |
| 3 | 6 | 42 | Christmas Special | 7.7 |
| 3 | 7 | 43 | Señor Macho Solo | 8.0 |
| 3 | 8 | 44 | Flu Shot | 7.7 |
| 3 | 9 | 45 | Retreat to Move Forward | 7.9 |
| 3 | 10 | 46 | Generalissimo | 8.5 |
| 3 | 11 | 47 | St. Valentine’s Day | 8.2 |
| 3 | 12 | 48 | Larry King | 8.0 |
| 3 | 13 | 49 | Goodbye, My Friend | 8.0 |
| 3 | 14 | 50 | The Funcooker | 8.2 |
| 3 | 15 | 51 | The Bubble | 8.1 |
| 3 | 16 | 52 | Apollo, Apollo | 8.4 |
| 3 | 17 | 53 | Cutbacks | 7.6 |
| 3 | 18 | 54 | Jackie Jormp-Jomp | 7.9 |
| 3 | 19 | 55 | The Ones | 7.9 |
| 3 | 20 | 56 | The Natural Order | 7.8 |
| 3 | 21 | 57 | Mamma Mia | 8.0 |
| 3 | 22 | 58 | Kidney Now! | 8.6 |
| 4 | 1 | 59 | Season 4 | 7.7 |
| 4 | 2 | 60 | Into the Crevasse | 7.7 |
| 4 | 3 | 61 | Stone Mountain | 7.7 |
| 4 | 4 | 62 | Audition Day | 7.9 |
| 4 | 5 | 63 | The Problem Solvers | 7.9 |
| 4 | 6 | 64 | Sun Tea | 7.7 |
| 4 | 7 | 65 | Dealbreakers Talk Show #0001 | 8.1 |
| 4 | 8 | 66 | Secret Santa | 8.0 |
| 4 | 9 | 67 | Klaus and Greta | 8.3 |
| 4 | 10 | 68 | Black Light Attack! | 7.9 |
| 4 | 11 | 69 | Winter Madness | 7.4 |
| 4 | 12 | 70 | Verna | 7.6 |
| 4 | 13 | 71 | Anna Howard Shaw Day | 8.5 |
| 4 | 14 | 72 | Future Husband | 7.7 |
| 4 | 15 | 73 | Don Geiss, America, and Hope | 7.9 |
| 4 | 16 | 74 | Floyd | 7.8 |
| 4 | 17 | 75 | Lee Marvin vs. Derek Jeter | 7.8 |
| 4 | 18 | 76 | Khonani | 7.4 |
| 4 | 19 | 77 | Argus | 7.6 |
| 4 | 20 | 78 | The Moms | 7.7 |
| 4 | 21 | 79 | Emmanuelle Goes to Dinosaur Land | 8.1 |
| 4 | 22 | 80 | I Do Do | 8.5 |
| 5 | 1 | 81 | The Fabian Strategy | 7.9 |
| 5 | 2 | 82 | When It Rains, It Pours | 8.2 |
| 5 | 3 | 83 | Let’s Stay Together | 7.7 |
| 5 | 4 | 84 | Live Show | 8.5 |
| 5 | 5 | 85 | Reaganing | 8.0 |
| 5 | 6 | 86 | Gentleman’s Intermission | 7.8 |
| 5 | 7 | 87 | Brooklyn Without Limits | 7.9 |
| 5 | 8 | 88 | College | 7.8 |
| 5 | 9 | 89 | Chain Reaction of Mental Anguish | 7.6 |
| 5 | 10 | 90 | Christmas Attack Zone | 7.9 |
| 5 | 11 | 91 | Mrs. Donaghy | 8.2 |
| 5 | 12 | 92 | Operation Righteous Cowboy Lightning | 8.3 |
| 5 | 13 | 93 | ¡Qué Sorpresa! | 7.9 |
| 5 | 14 | 94 | Double-Edged Sword | 8.3 |
| 5 | 15 | 95 | It’s Never Too Late for Now | 8.2 |
| 5 | 16 | 96 | TGS Hates Women | 8.2 |
| 5 | 17 | 97 | Queen of Jordan | 7.5 |
| 5 | 18 | 98 | Plan B | 7.8 |
| 5 | 19 | 99 | I Heart Connecticut | 7.6 |
| 5 | 20 | 100 | 100: Part 1 | 8.0 |
| 5 | 21 | 101 | 100: Part 2 | 8.4 |
| 5 | 22 | 102 | Everything Sunny All the Time Always | 7.9 |
| 5 | 23 | 103 | Respawn | 7.6 |
| 6 | 1 | 104 | Dance Like Nobody’s Watching | 7.9 |
| 6 | 2 | 105 | Idiots Are People Two! | 7.8 |
| 6 | 3 | 106 | Idiots Are People Three! | 7.9 |
| 6 | 4 | 107 | The Ballad of Kenneth Parcell | 7.7 |
| 6 | 5 | 108 | Today You Are a Man | 7.8 |
| 6 | 6 | 109 | Hey, Baby, What’s Wrong?: Part 1 | 7.7 |
| 6 | 7 | 110 | Hey, Baby, What’s Wrong?: Part 2 | 7.9 |
| 6 | 8 | 111 | The Tuxedo Begins | 8.4 |
| 6 | 9 | 112 | Leap Day | 8.1 |
| 6 | 10 | 113 | Alexis Goodlooking and the Case of the Missing Whisky | 7.6 |
| 6 | 11 | 114 | Standards and Practices | 7.9 |
| 6 | 12 | 115 | St. Patrick’s Day | 7.6 |
| 6 | 13 | 116 | Grandmentor | 7.4 |
| 6 | 14 | 117 | Kidnapped by Danger | 8.2 |
| 6 | 15 | 118 | The Shower Principle | 7.4 |
| 6 | 16 | 119 | Nothing Left to Lose | 7.5 |
| 6 | 17 | 120 | Meet the Woggels! | 7.5 |
| 6 | 18 | 121 | Murphy Brown Lied to Us | 7.7 |
| 6 | 19 | 122 | Live from Studio 6H | 8.5 |
| 6 | 20 | 123 | Queen of Jordan 2: The Mystery of the Phantom Pooper | 7.2 |
| 6 | 21 | 124 | The Return of Avery Jessup | 7.6 |
| 6 | 22 | 125 | What Will Happen to the Gang Next Year? | 7.8 |
| 7 | 1 | 126 | The Beginning of the End | 7.6 |
| 7 | 2 | 127 | Governor Dunston | 7.6 |
| 7 | 3 | 128 | Stride of Pride | 7.7 |
| 7 | 4 | 129 | Unwindulax | 7.8 |
| 7 | 5 | 130 | There’s No I in America | 7.5 |
| 7 | 6 | 131 | Aunt Phatso vs. Jack Donaghy | 7.5 |
| 7 | 7 | 132 | Mazel Tov, Dummies! | 8.2 |
| 7 | 8 | 133 | My Whole Life is Thunder | 7.9 |
| 7 | 9 | 134 | Game Over | 8.3 |
| 7 | 10 | 135 | Florida | 7.9 |
| 7 | 11 | 136 | A Goon’s Deed in a Weary World | 8.3 |
| 7 | 12 | 137 | Hogcock! | 8.9 |
| 7 | 13 | 138 | Last Lunch | 9.2 |
Separated by season, with seasonal averages
| Ep. # | Season 1 | Season 2 | Season 3 | Season 4 | Season 5 | Season 6 | Season 7 |
|---|---|---|---|---|---|---|---|
| 1 | 7.2 | 8.2 | 8.1 | 7.7 | 7.9 | 7.9 | 7.6 |
| 2 | 7.5 | 7.9 | 8.4 | 7.7 | 8.2 | 7.8 | 7.6 |
| 3 | 7.8 | 7.7 | 7.9 | 7.7 | 7.7 | 7.9 | 7.7 |
| 4 | 7.4 | 8.1 | 8.1 | 7.9 | 8.5 | 7.7 | 7.8 |
| 5 | 8.0 | 8.2 | 8.5 | 7.9 | 8.0 | 7.8 | 7.5 |
| 6 | 7.6 | 8.1 | 7.7 | 7.7 | 7.8 | 7.7 | 7.5 |
| 7 | 8.2 | 8.0 | 8.0 | 8.1 | 7.9 | 7.9 | 8.2 |
| 8 | 7.7 | 7.7 | 7.7 | 8.0 | 7.8 | 8.4 | 7.9 |
| 9 | 7.9 | 8.1 | 7.9 | 8.3 | 7.6 | 8.1 | 8.3 |
| 10 | 7.9 | 7.9 | 8.5 | 7.9 | 7.9 | 7.6 | 7.9 |
| 11 | 8.1 | 8.3 | 8.2 | 7.4 | 8.2 | 7.9 | 8.3 |
| 12 | 8.4 | 7.6 | 8.0 | 7.6 | 8.3 | 7.6 | 8.9 |
| 13 | 7.9 | 8.3 | 8.0 | 8.5 | 7.9 | 7.4 | 9.2 |
| 14 | 7.8 | 8.0 | 8.2 | 7.7 | 8.3 | 8.2 | |
| 15 | 8.3 | 8.3 | 8.1 | 7.9 | 8.2 | 7.4 | |
| 16 | 7.7 | 8.4 | 7.8 | 8.2 | 7.5 | ||
| 17 | 7.8 | 7.6 | 7.8 | 7.5 | 7.5 | ||
| 18 | 8.1 | 7.9 | 7.4 | 7.8 | 7.7 | ||
| 19 | 7.7 | 7.9 | 7.6 | 7.6 | 8.5 | ||
| 20 | 8.0 | 7.8 | 7.7 | 8.0 | 7.2 | ||
| 21 | 8.1 | 8.0 | 8.1 | 8.4 | 7.6 | ||
| 22 | 8.6 | 8.5 | 7.9 | 7.8 | |||
| 23 | 7.6 | ||||||
| Avg. | 7.9 | 8.0 | 8.1 | 7.9 | 8.0 | 7.8 | 8.0 |
How many episodes are rated the same?
| Rating | Frequency |
|---|---|
| 7.2 | 2 |
| 7.4 | 5 |
| 7.5 | 6 |
| 7.6 | 13 |
| 7.7 | 18 |
| 7.8 | 13 |
| 7.9 | 24 |
| 8.0 | 11 |
| 8.1 | 12 |
| 8.2 | 11 |
| 8.3 | 9 |
| 8.4 | 5 |
| 8.5 | 6 |
| 8.6 | 1 |
| 8.9 | 1 |
| 9.2 | 1 |


I think the real issue is probably more the simple fact that this is a bar graph and not a line graph. The point of these graphs is to compare each episode relative to each other, not to compare relative to zero. In that case, a line graph with a Y axis ranging from 7-9.5 makes sense.
Or I could just make this a triangle graph…
What’s a triangle graph…?
Still doesn’t make sense with the bottom cut off. Imagine it as comparing the height of a bunch of people, say Americans vs Asians just going for a large difference here, if you start the chart at 4 feet, then you are going to get a very different feel from it compared to one started at 0. It will imply a even larger difference than there is
Don’t trim your graphs.